


The Secret to Supply Chain Efficiency
Balancing Forecast Accuracy with Business Value

Forecasts are never 100% accurate, but without tracking accuracy metrics, you won’t know how wrong you are!
Demand is never constant, neither is it perfectly predictable. That’s why demand forecasting should be an unnegotiable component at the heart of your supply chain operations.

There’re many forecast accuracy metrics available for forecasters. Most of them are a variation of these: forecast bias, mean absolute deviation (MAD), and mean absolute percentage error (MAPE). If you’ve read this far, you’re a supply chain practitioner or have a keen interest in supply chain management. You may be familiar with these metrics.
My article goes further than simple formulas. Hang on for guidance on how to apply the metrics based on sample datasets and under different scenarios. I illustrate these metrics on single product forecasts, as well as grouped products forecasts.
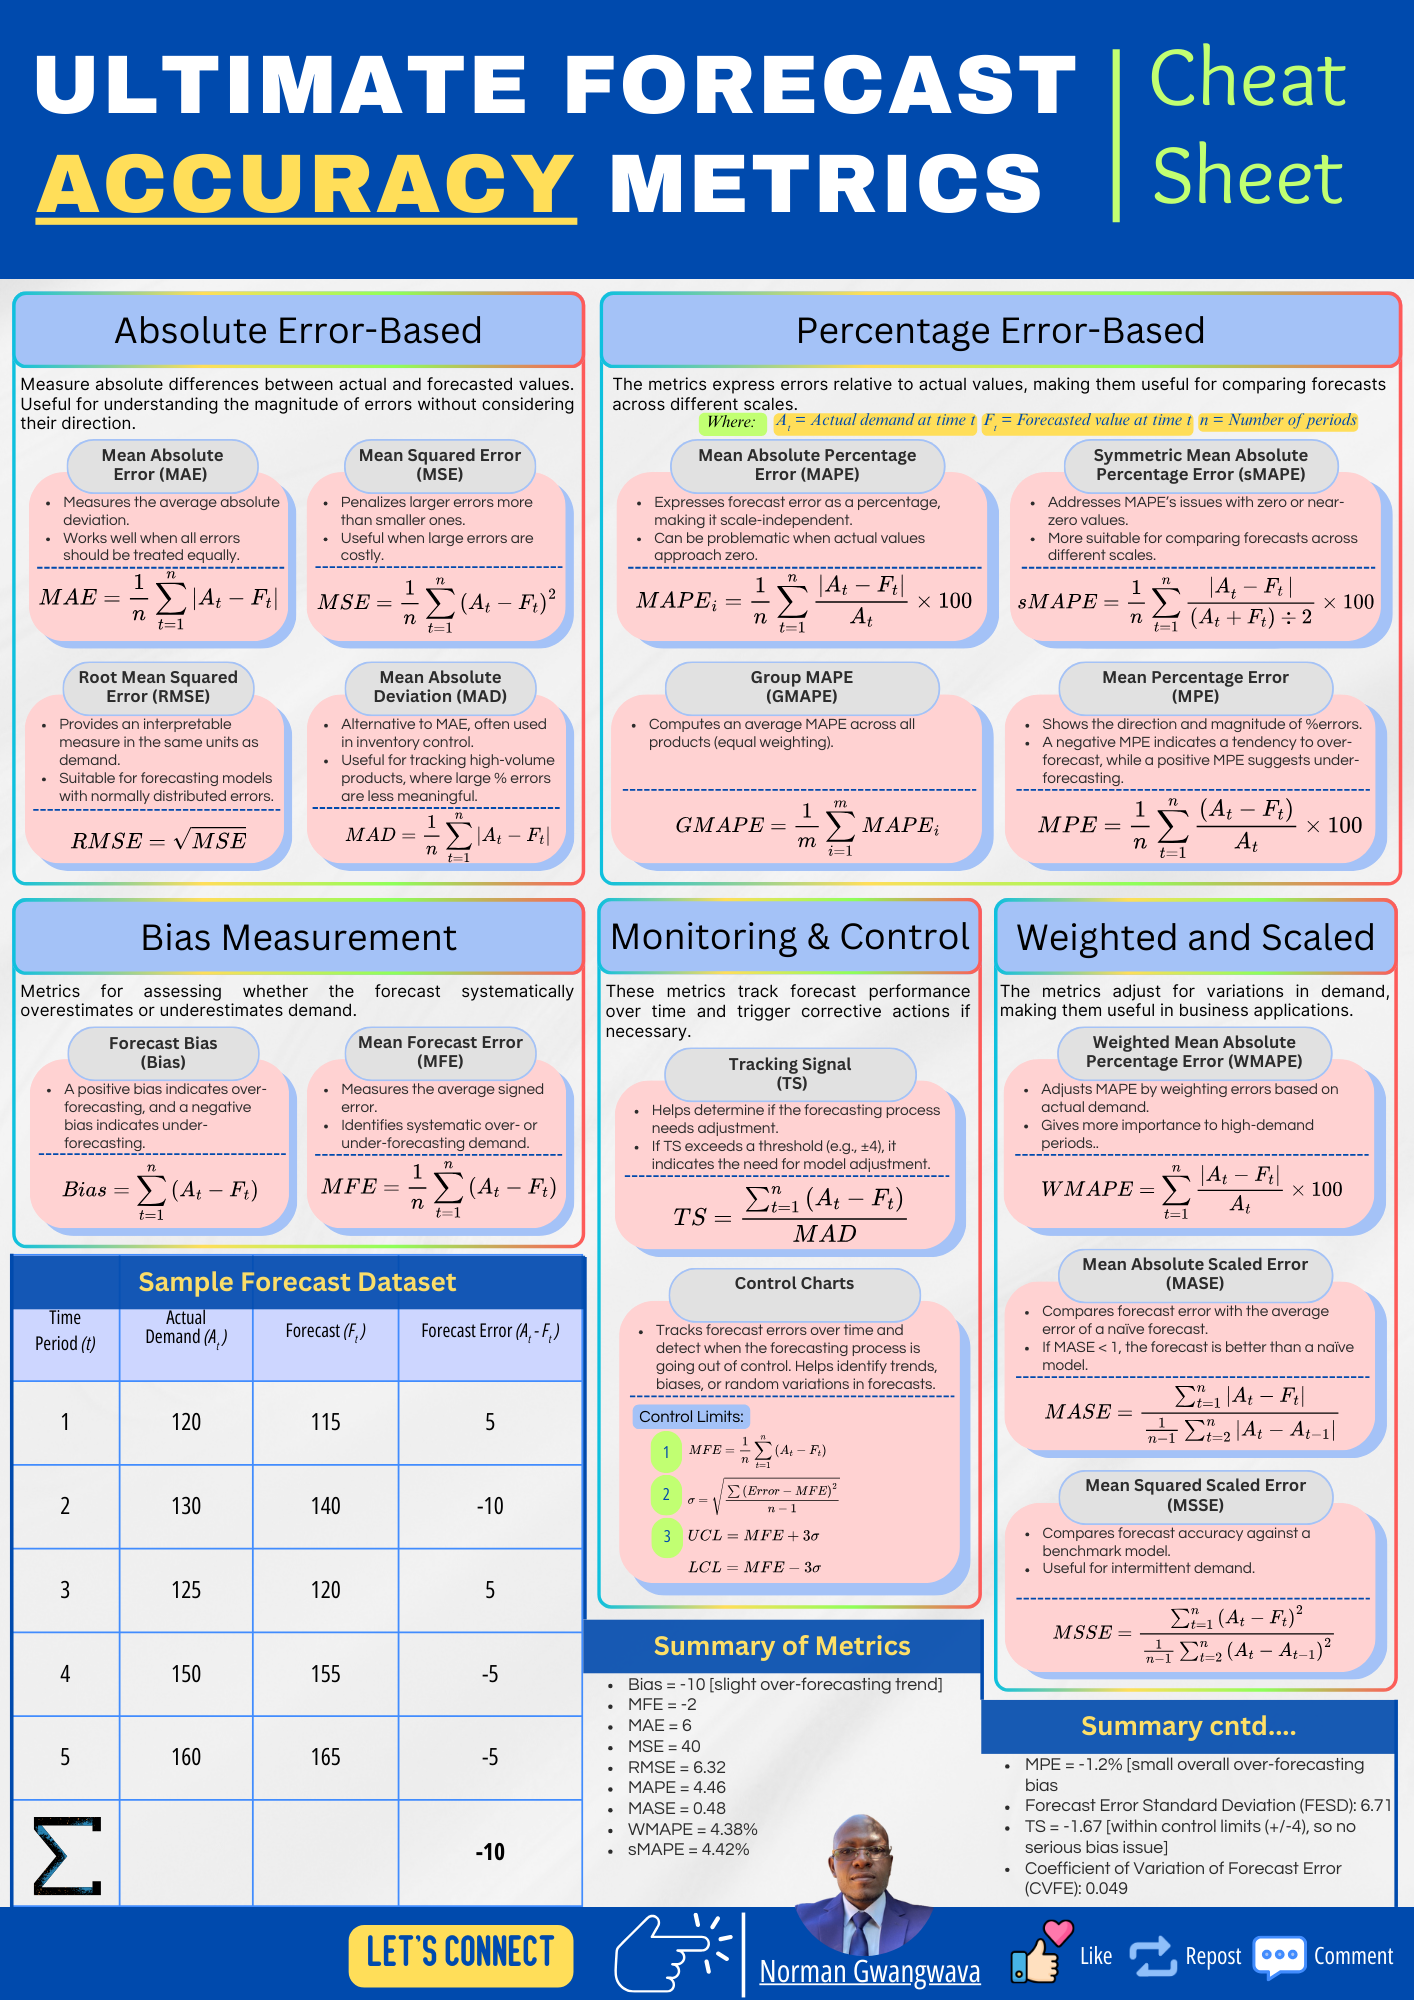
Forecast accuracy metrics can be divided into five categories:
Absolute Error-Based
Bias Measurement
Percentage Error-Based
Weighted and Scaled Metrics
Monitoring and Control Metrics
The notation used throughout the post is as follows:
1. Absolute Error-Based:
These metrics measure absolute differences between actual and forecasted values. Useful for understanding the magnitude of errors without considering their direction.
2. Bias Measurement:
Metrics for assessing whether the forecast systematically overestimates or underestimates demand.
There’re two metrics under this category.
(a) Forecast Bias
A positive bias indicates under-forecasting, and a negative bias indicates over-forecasting.
· Positive Bias (%) → Persistent under-forecasting (forecasts too low).
· Negative Bias (%) → Persistent over-forecasting (forecasts too high).
· Bias close to 0% → Forecast is relatively unbiased over time.
(b) Mean Forecast Error (MFE)
MFE measures the average signed error. It identifies systematic over- or under-forecasting demand.
3. Detailed Forecast Accuracy Cheat Sheet
Let’s cut the chase with my detailed cheat sheet. It covers all the five categories of the metrics.
👉 You can get the full resolution PDF file here: 🎁 Free bonus
4. Grouped product application using sample datasets
We have three products over five time periods:

General Interpretation of Metric Values
The values of MAPE, WMAPE, and GMAPE indicate how well your forecast aligns with actual demand. However, interpretation depends on industry benchmarks, demand characteristics, and business context.

In our case:
Product 1 (High Volume) -> (4.46%): Excellent accuracy
Product 2 (Low Volume) -> (6.67%): Good accuracy
Product 3 (Medium Volume) -> (2.60%): Excellent accuracy
Overall WMAPE (4.10%): Highly accurate. More reliable as it accounts for volume differences.
GMAPE (grouped products) -> (4.58%): Indicates strong accuracy across all products, but each product is weighted equally, regardless of volume.
Key Observations:
The low-volume product (Product 2) has the highest MAPE, showing how percentage errors can be misleading for small demand values.
WMAPE is lower than GMAPE, which means the forecast was relatively better for high-volume products. WMAPE is a better measure in cases where volume matters, preventing low-volume products from skewing results.
For slow-moving products, consider using MSSE (Mean Squared Scaled Error) instead of MAPE.
For high-value items, consider using Weighted Absolute Percentage Error (WMAPE) to avoid overemphasizing low-volume items.
Industry-Specific Considerations
Low-Volume, High-Value Products (e.g., luxury items, aerospace parts)
MAPE tends to be high, as one unit difference can significantly impact percentage error.
WMAPE or MAD is preferred for better assessment.
High-Volume, Low-Cost Products (e.g., groceries, packaged goods)
MAPE below 10% is achievable.
Control charts help track stability over time.
Intermittent Demand (e.g., spare parts, seasonal items)
MSSE is a better choice than MAPE.
High MAPE does not always mean poor forecasting.
Product segmentation:
Segmenting products by both demand velocity (Fast-Moving vs. Slow-Moving) and volume (High-Volume vs. Low-Volume) provides a more refined analysis of forecast accuracy.
Different types of products behave differently in forecasting:
➡️ Fast-moving, high-volume products → Require high forecast accuracy because they drive revenue.
➡️ Slow-moving, low-volume products → Forecasting errors may seem large (high MAPE), but they have less business impact.