
Inventory Control Techniques That Actually Work
From EOQ to ABC & XYZ: Proven Methods to Optimize Stock and Slash Costs

Inventory control isn’t about how much stock you hold. It’s about how well you manage what matters.
Many supply chain leaders and operations teams struggle with stockouts, bloated warehouses, or locked-up working capital. But the real problem isn’t always demand. It’s ineffective inventory control.
In this guide, I walk you through the most prominent inventory control techniques that top-performing supply chains use—not as theory, but as practical tools tied to business outcomes like:
Lower carrying costs
Improved stock availability
Better forecast accuracy
Reduced waste and working capital
Whether you're a supply chain manager, analyst, or operations leader upskilling in AI and analytics, this is your go-to resource for mastering inventory fundamentals.
📅 Download the Inventory Control Toolkit
Get the complete workbook with templates, formulas, and visuals.
✅ Includes:
ABC/XYZ calculator
EOQ & ROP computation sheets
Inventory segmentation matrix
📢 Share This Post
📆 Subscribe for Weekly Supply Chain Insights
Want more guides like this one? Subscribe to the newsletter for practical playbooks on AI in Supply Chain, inventory optimization, and digital transformation.
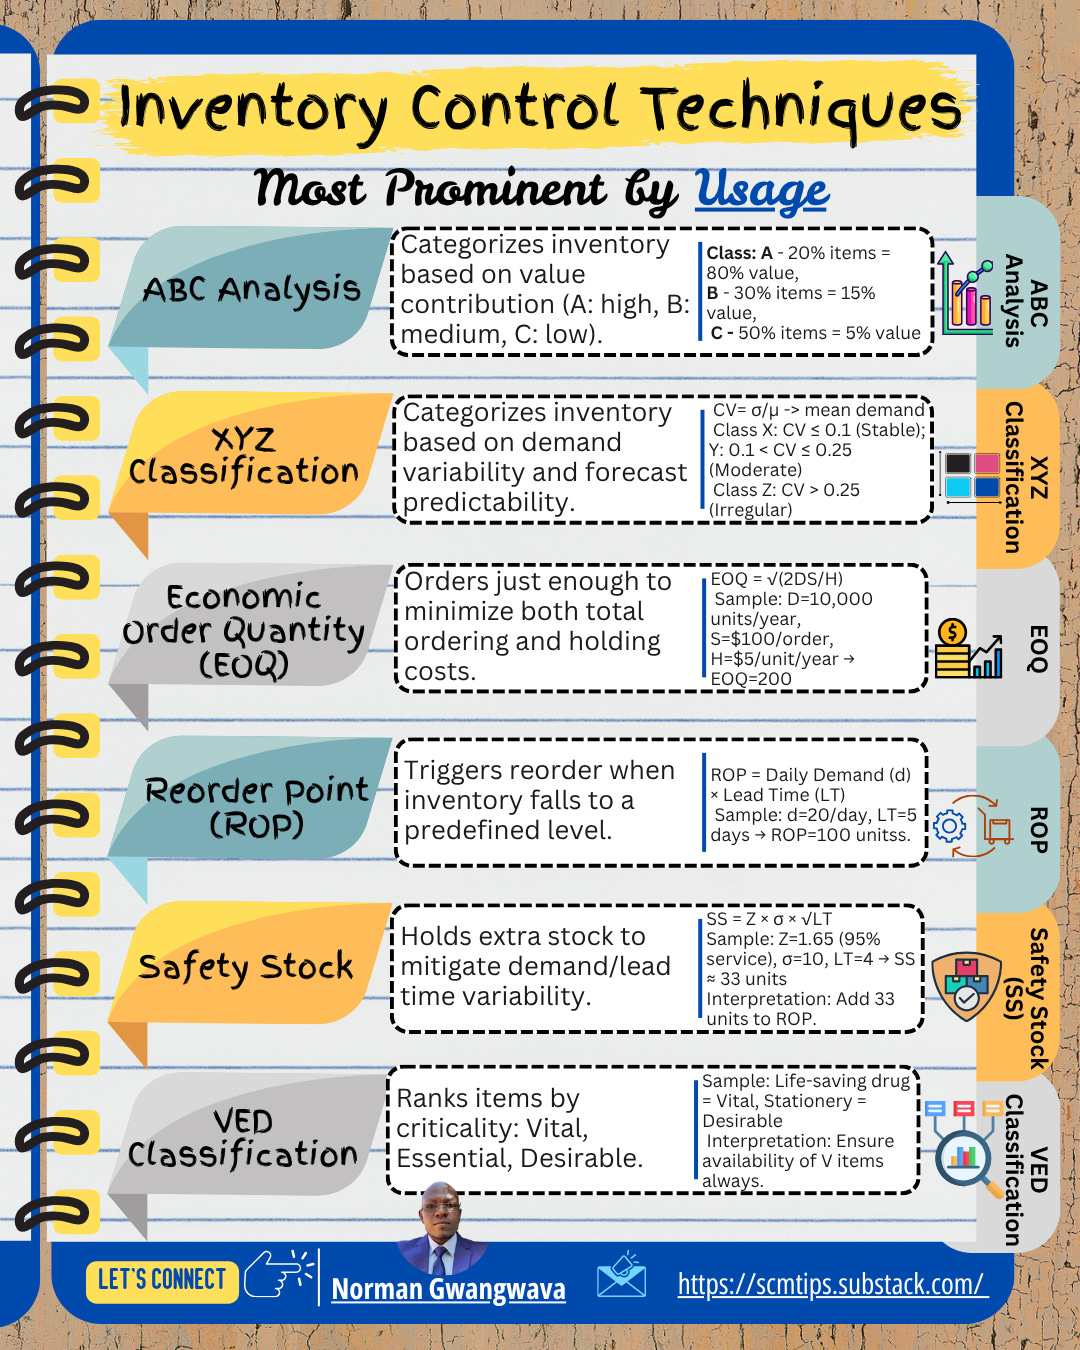
#1 – ABC Analysis
What it is
Categorizes inventory based on value contribution.
A-items = high value, tight control
B-items = moderate value
C-items = low value, basic controls
How it does
Sort SKUs by annual consumption value:
Class A: 20% items = 80% value
Class B: 30% items = 15% value
Class C: 50% items = 5% value
Interpretation: Focus control on Class A, routine check on C.
#2 – XYZ Classification
What it is
Categorizes SKUs based on demand variability.
How it does
Uses Coefficient of Variation:
X: CV ≤ 0.10 (stable)
Y: 0.10 < CV ≤ 0.25 (moderate)
Z: CV > 0.25 (erratic)
Example
SKU2: σ = 12, μ = 120 → CV = 0.10 → Class X
Interpretation
Class X: low safety stock Class Z: high buffers, flexible replenishment
#3 – Economic Order Quantity (EOQ)
What it is
Optimizes how much to order to minimize holding and ordering cost.
How it does
Where:
D = Annual demand
S = Order cost
H = Holding cost per unit
Example
D = 4,800; S = $100; H = $10 → EOQ = 309 units
Interpretation
Order in lots of 309 to balance ordering vs. holding cost.
#4 – Safety Stock
What it is
Extra stock held to absorb demand or lead time variability.
How it does
Z = Z-score for service level
Example
Z = 1.65, σ = 15, LT = 4 → SS = 1.65 × 15 × 2 = 49.5 units
Interpretation
Use to avoid stockouts under variability.
#5 – Reorder Point (ROP)
What it is
The inventory level that triggers a replenishment order.
How it does
Add safety stock if needed:
Example
Demand = 30/day, LT = 5 days, SS = 50 → ROP = 200
Interpretation
Prevents late reordering and stockouts.
#6 – Two Bin Technique
What it is
Visual system using two bins: working + reserve stock.
How it does
Use from Bin 1. When empty, reorder using Bin 2 reserve.
Example
Bin 1 = 100 units, Bin 2 = 50 (covers LT demand)
Interpretation
Ideal for manual environments or maintenance stores.
#7 – VED Classification
What it is
Ranks items by criticality.
Vital
Essential
Desirable
How it does
Subjective based on operational impact.
Example
Ventilator part = Vital; Office supplies = Desirable
Interpretation
Use in healthcare, aerospace, and public sector systems.
#8 – HML Classification
What it is
Ranks items by unit price.
How it does
Sort by per-unit cost:
High, Medium, Low
Example
Sensor = $1,200 = High Bolt = $1 = Low
Interpretation
Focus controls on high-cost SKUs.
#9 – SDE Classification
What it is
Ranks by procurement difficulty:
Scarce
Difficult
Easy
How it does
Assessed by buyer or planner based on market access
Example
Specialty chip = Scarce; Local cap = Easy
Interpretation
Helps adjust lead time buffers and sourcing strategy.
#10 – FSN Classification
What it is
Ranks by consumption velocity:
Fast, Slow, Non-moving
How it does
Measured by transaction frequency over a time period.
Example
SKU sold weekly = Fast SKU unused in 6 months = Non-moving
Interpretation
Use to clean up dead stock and rationalize SKUs.
#11 – Order Cycling System
What it is
Fixed-interval review system.
How it does
Review and reorder stock on scheduled dates.
Example
Every 1st and 15th of the month.
Interpretation
Useful in stable environments, low admin effort.
#12 – Just-In-Time (JIT)
What it is
Minimizes on-hand inventory by syncing supply with demand.
How it does
Requires tight supplier integration and fast lead times.
Example
Auto plant receives wheels 1 hour before assembly.
Interpretation
Reduces waste, but vulnerable to disruption.
📩 Stay Ahead
🤔 Let’s Talk
I’d love to hear your thoughts about inventory control practices.
What’s your go-to method for inventory control?
Do you combine techniques like ABC+XYZ, run MRP-based planning, or DDMRP?
Drop a comment or share your experience.
Your insights might help shape how others approach their AI in Supply Chain journey.